
Purpose: See how many of selected items were sold over a period and for how much, and export the results to Excel. For: owners, managers.
Steps #
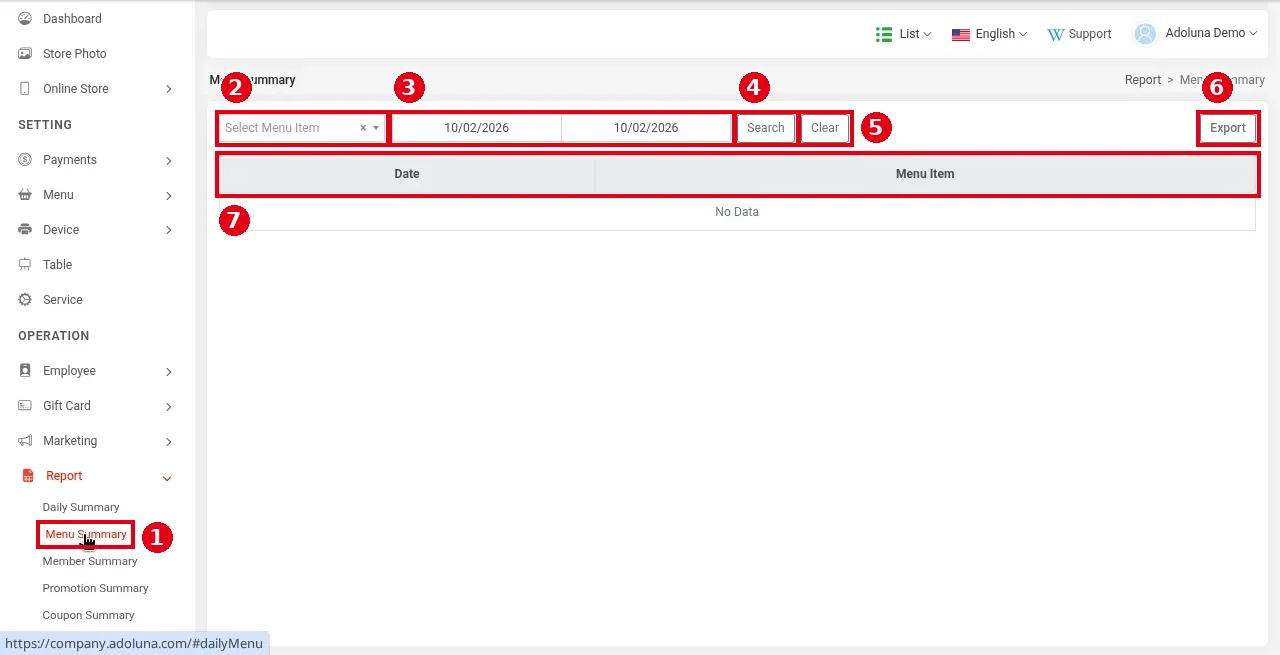
1. In the Backoffice left menu click Report > ① Menu Summary.
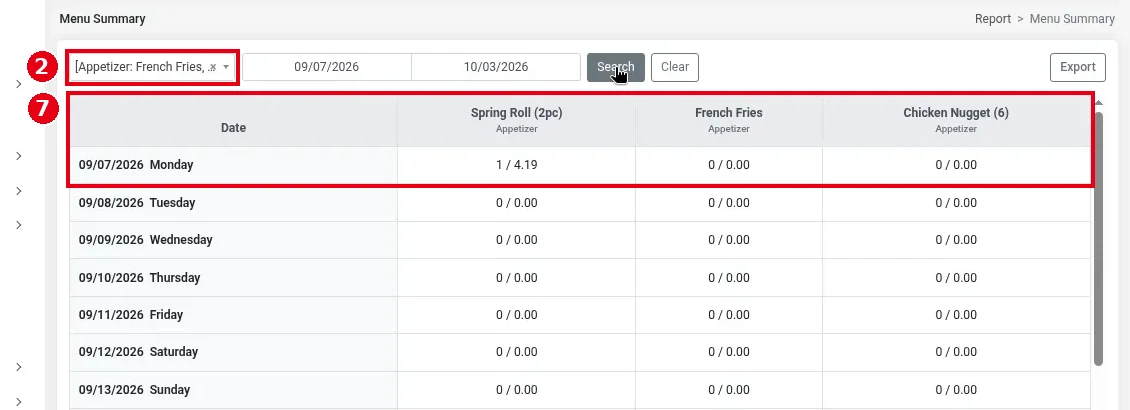
2. In ② Select Menu Item, choose the items to analyse (you can pick several or Select All; click × to clear). You must choose items first: if you click Search with none selected, it shows No Data rather than listing every item.
3. Choose the start and end dates in ③ and click ④ Search (⑤ Clear resets the filters).
4. ⑦ There’s one row per day (the Date column shows the date and the day of the week) and one column per selected item; each cell shows “quantity / amount” (e.g. 1 / 4.19 means 1 sold for 4.19). If there’s nothing for the dates, it shows No Data.
5. Click ⑥ Export to download the results as an Excel file.
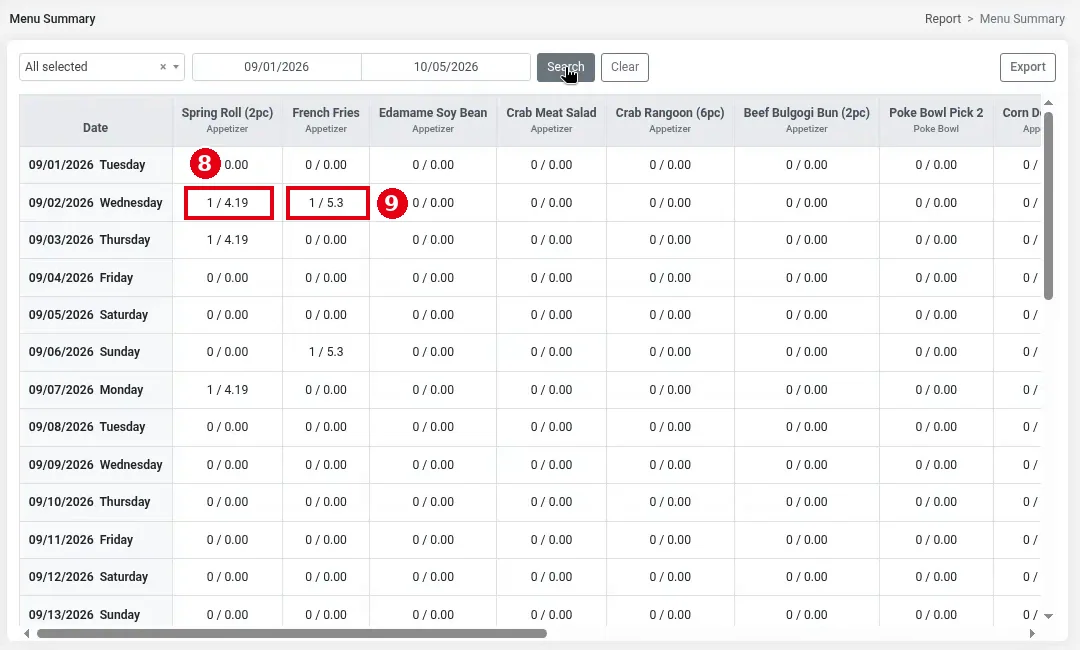
The result below is for 2026-09-01 to 2026-10-05 with all items selected: ⑧ Spring Roll (2pc) shows 1 / 4.19 and ⑨ French Fries shows 1 / 5.3, both including tax.
Notes / FAQ #
-
Amounts include tax: e.g. French Fries is $5.00 on the menu and shows 1 / 5.3; Spring Roll (2pc) is $3.95 and shows 1 / 4.19 (6% tax). Voids and discounts don’t appear in this report: the grid only has quantity and amount, with no void or discount rows or columns.
-
The POS Item Sales, Category Sum and Group Sum reports also show sales by item, category and menu group (see 1.5.6 How to view, print or email POS reports); for menu groups, see 2.3.3 How to set up menu groups for reporting.


